We propose a new approach for the quantitative characterization of cognitive human brain activity during visual perception. According to the theoretical background we analyze human electro-encephalograms (EEG) obtained while the subjects observe ambiguous images. We found that the decision-making process is characterized by specific oscillatory patterns in the multi-channel EEG data.
Introduction
A study of nonlinear processes in the brain neural network during perception of “ambiguous” (also known as bi- and multistable) images is very important for the understanding of both the visual recognition of objects and the decision-making process. Nowadays, the perception of ambiguous images attracts huge attention of many scientists. In a sense, such images are good objects for studying the visual perception in general as well as the decision-making mechanisms. Images of this type have been the object of research for psychologists for a long time (Leopold & Logothetis, 1999; Sterzer & Kleinschmidt, 2009; Cao et al., 2014). Recently, ambiguous images awoke the interest of physicists and mathematicians (Pisarchik et al., 2014). Despite of considerable efforts of many researchers, the main mechanisms underlying interpretation of a multistable image are not well understood. At present, perception is known to be a result of nonlinear processes which take place in the distributed neural network of occipital, parietal and frontal regions of the brain cortex (Tong et al., 2006; Sterzer & Kleinschmidt, 2009).
The perception of ambiguous (bistable) images was thoroughly investigated in the last decade. The most popular bistable images are Rubin vase, Mach bands, Rorschach test, Boring’s old/young woman illusion, Necker cube, etc. (Leopold & Logothetis, 1999, Moreno-Bote et al., 2007). From a mathematical point of view, visual perception of bistable images comprises two metastable states, each with a duration that varies from seconds to tens of seconds. One of the perceived images usually dominates over the other for a relatively long period of time. The distribution of the intervals of dominance in each image has a stochastic nature with gamma probability distribution (Huguet et al., 2014; Leopold & Logothetis, 1999; Wang, 2012). Bifurcation analysis and catastrophe theory show that the shift between two percepts of an ambiguous image is linked to the intensity of intrinsic individual “cognitive brain noise” caused by neuronal spontaneous activity (Pisarchik et al., 2014).
These fundamental results are important to create an objective paradigm for data processing in cognitive research, because the application of traditional neurophysiological methods solely, such as, expert estimations and simple measures of the signal amplitude, may simplify our understanding of the process. Therefore, the fine and short-lasting process might be overlooked. The development of standardized methods has an important practical application in neurophysiological experiments, including data acquisition, evaluation, analysis and processing of results in already recorded data, as well as in real time, and it is still an open field for research activity. International research in cognitive studies readily engages in the modeling of cognitive and neurophysiological processes using nonlinear dynamics tools (Rabinovich et al., 2006; Hramov et al., 2015).
Methods
Experiment
In our physiological experiment with EEG activity registration we used a set of images based on a well-known bistable object, the Necker cube (Necker, 1832), as a visual stimulus. This is a cube with transparent faces and visible ribs; an observer without any perception abnormalities treats the Necker cube as a 3D-object thanks to the specific position of the cube ribs. Bistability in perception consists in the interpretation of this 3D-object as to be oriented in two different ways, in particular, if the different ribs of the Necker cube are drawn with different intensity. Figure 1 shows various examples of the Necker cube image with varying parameter I to be the brightness of the cube wires converging in the right upper inner corner. The brightness of the wires converging in the left lower inner corner is defined as (1-I).

Figure 1. Examples of Necker cube images with different rib contrast I
The experimental studies were performed in accordance with the ethical standards (World Medical Association, 2000). Forty healthy subjects from a group of unpaid volunteers, male and female, between the ages of 18 and 45 with a normal or corrected-to-normal visual acuity participated in the experiments. The purpose of this experiment is the study of unconscious decision on ambiguous image interpretation.
We demonstrated the Necker cube images with different wireframe contrasts for a short time, each lasting between 0.2 and 0.7 seconds, interrupted by a background abstract picture for 2.5-3.5 seconds. The subject was instructed to press the left or right key depending on his/her interpretation of the projection being observed at each demonstration. Between subsequent demonstrations of different Necker cube images, other abstract pictures selected from a set of sufficiently bright background images were exhibited for 1000-1500 ms. The use of the background images allows the neutralization of possible negative secondary effect of the previous Necker cube image. The whole experiment lasted about 40 min for each patient.
During the experiment we exhibited the pictures of the Necker cube randomly, each for about 100 times, and recorded brain activity with multi-channel EEG. As a tool for EEG recording we used the electroencephalograph-reсorder Encephalan-EEGR-19/26 (Russia) with multiple EEG channels and the two-button input device. To study EEGs the monopolar registration method and the classical ten-twenty electrode system were used. Figure 2 shows an example of a typical EEG data set.
Wavelet-based methods
In our work we used continuous wavelet transform (CWT) (Koronovskii & Hramov, 2003; Pavlov et al., 2012) for time-frequency analysis of oscillatory patterns in EEG. CWT is a convolution of investigated signal x(t) (EEG signal in our case) and a set of basic functions  :
:
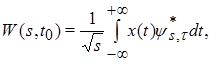 (1)
(1)
Each basic function from this set can be obtained from one function  , the so-called mother wavelet, by the following transform:
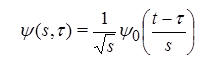 (2)
(2)
In equation (2) is the mother wavelet, s is the time scale determined extension or compression of the initial mother function, and τ is the time shift of wavelet transform.
Among various mother wavelets, in the present work we use CWT with the Morlet wavelet:
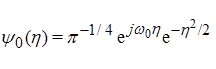 (3)
(3)
The complex Morlet wavelet (Kaiser, 1994) is a complex exponential modulated Gaussian function, exp(jω0η), where ω0 is a specific parameter that defined the frequency of the complex exponential. A Gaussian smoothing function, exp(−η2/2) enables high resolution in both time and frequency domains.
In the complex Morlet wavelet family (Eq. (3)), parameter ω0 determines the shape and the width of the wavelet function; therefore, this parameter influences time and frequency resolution in the resultant CWT. When ω0 < π, the temporal resolution was high, but frequency resolution was too low (so that the frequency information of analyzed EEG events was lost) and vice versa, when ω0 > 4 π, the frequency resolution was high, but the time resolution was low. Value ω0 = 2 π provided an optimal time–frequency resolution of the EEG signal that was sufficient for both investigated EEG phenomena (Koronovskii & Hramov, 2003). Another important feature of the complex Morlet wavelet is the lack of negative frequencies in Fourier space. This is profitable for the time–frequency representation of the EEG signal in the wavelet space; the Presence of negative Fourier frequencies in some wavelet basis functions (e.g., in Paul wavelet) might embarrass extracting frequency information from the analyzed signal and, thus, worsen time-scale resolution of the method.
In the complex Morlet wavelet family, the correspondence between time scales (s, in wavelet space) and frequencies (f, in Fourier space) can be computed by the formula (Koronovskii & Hramov, 2003):
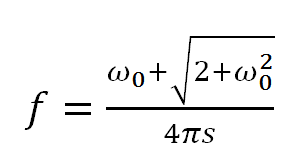 (4)
(4)
Where ω0 denotes the basis frequency of the Morlet mother wavelet. Noteworthy, for ω0 = 2 π the correspondence between s and f is simple, s ≈ 1/f, but it is more complex for the other ω0. In addition, we previously found (Luijtelaar et al., 2011; Sitnikova et al., 2014) that the CWT with the mother Morlet wavelet provides an optimal time–frequency resolution of EEG signals.
We averaged all wavelet spectra relating a particular image with the corresponding left or right button, for example, “image3” before pressing the left button. The concept of this method was based on the well-known method of evoked potentials.

Figure 2. Examples of a data set from a typical EEG recording from electroencephalograph Encephalan-EEGR-19/26. Red marks show the time moments which to make image of Necker cubes presentation with different parameters I. Blue labels show moments of pressing and squeezing the buttons on the remote
Results
The analysis of experimental data is based on the mathematical model described in (Pisarchik et al., 2014), where the bistable potential has been applied to explain a choice of the ambiguous image projection. Taking into account the influence of cognitive noise on visual perception, a stochastic differential equation leading to the Fokker-Plank equation was obtained.
In our research we conventionally named the Necker cube orientations as “left” and “right” according to the apparent position of the cube’s frontal face. In the experiment we used 8 – 16 different images of the Necker cube with different intensities of several key ribs. The intensity of the ribs was selected in a specific way to affect the bistable perception of the observer. For example, some images had an intensity distribution that would be likely interpreted as “left”, while other images as “right”, and one of the images had symmetrical intensity distribution.
We processed and analyzed the obtained EEG data. We had multi-channel EEG recordings with different markers: “imgN” type is the marker that shows the moment of presentation of an image, where N is the code name of an image with particular intensity distribution; “LClick” or “RClick” type is the marker that shows the moment when a subject pressed one of the buttons on the input device, L for the left button and R for the right button. Therefore, for each image of the Necker cube we had two cases corresponding to either “left” or “right” cube orientations. We analyzed each of these cases separately because of the difference in the EEG structure caused by different orientation.
We analyzed the time-frequency structure of the EEG recordings just after image presentation (“imgN” marker), before response (“LClick/RClick” marker), and a short time interval after it. The whole duration of the analyzed interval is about 3 s. Figure 3 shows the average wavelet surface for the presented cubes with different rib intensities on the boundary of different choices of the same subject. The figure shows the dynamics of different frequency wave processes observed in the EEG signals. It should be noted that the decision-making process (“whether the cube orientation is left or right”) is characterized by the destruction of the alpha rhythm patterns (about 10 Hz). The virtually definitive patterns are hardly observed (see figure 3 c). Then the destruction of the alpha rhythm coincides with the beginning of the generation of high-frequency oscillations patterns. Next, we will describe the dynamics in this frequency range (30-40 Hz) in more detail.
 in the time interval during perception of the Necker cube with different rib intensities: a I = 40, b I = 64, с I = 85. The vertical line marks the moment of the image presentation. Figures a and b correspond to a left-button press and figure c to a right-button press")
Figure 3. The averaged wavelet characteristics of calculated by EEG fragment recordings O2 (occipital) in the time interval
during perception of the Necker cube with different rib intensities: a I = 40, b I = 64, с I = 85. The vertical line marks the moment
of the image presentation. Figures a and b correspond to a left-button press and figure c to a right-button press
Obviously, a joint analysis of all 19 channels of the electrodes, ten-twenty used placement leads to complicated visualization problems. In this regard, we propose a method for simultaneous visualization of all EEG channels data in the main frequency range. Figure 4 shows the characteristic appearance of the wave activity in the EEG data at some point in time: before the cube presentation, immediately after the cube was presented, just before pressing the remote control button (i.e., at the time of the decision), and at the time of “relax” (after pressing the button and before the next cube image was presented). The first and the last EEG are similar, because they were obtained for the same subject condition, i.e., when the cube image was not presented yet.
The analysis of distribution dynamics of the wave activity in the frequency range on the EEG data demonstrates activity in a certain area of the left hemisphere every time the cube was presented, with parameter I ≈ 50 (i.e. the images are considerably bistable, see Figure 4, middle row). The bottom row in Figure 4 demonstrates that in the case of presenting the practically monostable Necker cube (I = 85), no high-frequency activity zone was observed.
The results were similar for all of the subjects under investigation. In particular, the destruction of the alpha rhythm patterns (about 10 Hz) was observed in 89% of patients. The same type of patterns at a higher frequency (30–40 or 35–45 Hz) could be detected in 82-85% of the 40 volunteers.
Discussion
In our work we constructed the wavelet spectra for short parts of the EEG signal between markers, and analyzed the EEG signal structure. Another important part of the present research is intrinsic time-frequency dynamics in EEG patterns associated with bistable visual perception. We analyzed these averaged wavelet distributions to find trends in bistable visual perception. The concept of this approach is based on the well-known method of evoked potentials.

Figure 4. Energy distribution of wave activity in the frequency range of 35-45 Hz in all channels of EEG in the classic
ten-twenty electrode system
In the paper we have studied the research activity of the human brain using the EEG data during visual perception of ambiguous objects. A new approach based on the CWT to study EEG data occipital leads, demonstrates characteristic patterns associated with the choice of one or another variant perception, as well as the subsequent decay of the activity of choice at the time the brain is resting. Further research will be focused on greater formalization of the experimental conditions to eliminate the influence of certain distractions, for example, eye movement or environmental conditions. Another goal could be to find the correspondence between noise introduced in early-developed mathematical models and detected in the EEG patterns.
Mapping the high frequency activity of the brain enables the accurate determination of the time intervals when a subject observes and identifies the type of ambiguous image. In addition, we assume possible association between the oscillations at high frequencies of about 30-40 Hz and complications in decision-making. The mathematical analysis of neurophysiological processes during visual perception of ambiguous objects is of particular interest for deeper understanding of mechanisms underlying cognitive brain functioning.
| Attachment | Size |
|---|---|
| 1.47 MB |
This work has been supported by the Russian Science Foundation (Grant No. 16-12-10100).
CAO R., BRAUN J., MATTIA M. (2014): Stochastic accumulation by cortical columns may explain the scalar property of multistable perception, Physical Review Letters 113, 098103.
HRAMOV A. E., KORONOVSKII A. A., MAKAROV V. A., PAVLOV A. N., SITNIKOVA E. (2015): Wavelets in Neuroscience, Springer Series in Synergetics, Springer, Heidelberg, New York, Dordrecht, London.
HUGUET G., RINZEL J., HUPE J.-M. (2014): Noise and adaptation in multistable perception: Noise drives when to switch, adaptation determines percept choice, Journal of Vision 14 (3), 1–24.
KAISER G. (1994): A friendly guide to wavelets. Boston: Birkhauser; 1994.
KORONOVSKII A. A., HRAMOV A. E. (2003): Continuous wavelet analysis and its applications, Moscow, Fizmatlit.
LEOPOLD D. A., LOGOTHETIS N. K. (1999) Multistable phenomena: changing views in perception, Trends in Cognitive Sciences 3 (7), 254–264.
MORENO-BOTE R., RINZEL J., RUBIN N. (2007): Noise-induced alternations in an attractor network model of perceptual bistability, Journal of Neurophysiology 98, 1125–1139.
NECKER L. A. (1832): Observations on some remarkable phenomena seen in Switzerland; and an optical phenomenon which occurs on viewing of a crystal or geometrical solid, Philos. Mag. 3, 329–343.
PAVLOV A. N., HRAMOV A. E., KORONOVSKII A. A., SITNIKOVA Y. E., MAKAROV V. A., OVCHINNIKOV A. A. (2012): Wavelet analysis in neurodynamics, Physics-Uspekhi 55 (9), 845–875.
PISARCHIK A. N., JAIMES-REATEGUI R., MAGALLON-GARCIA,C. D. A., CASTILLO-MORALES C. O. (2014): Critical slowing down and noise-induced intermittency in bistable perception: bifurcation analysis, Biological Cybernetics 108 (4), 397–404.
RABINOVICH M. I., VARONA P., SELVERSTON A. I., ABARBANEL H. D. I. (2006): Dynamical principles in neuroscience, Rev. Mod. Phys. 78, 1213–1265.
SITNIKOVA E., HRAMOV A. E., GRUBOV V., KORONOVSKY A. A. (2014): Time-frequency characteristics and dynamics of sleep spindles in Wag/Rij rats with absence epilepsy, Brain Research 1543, 290–299.
STERZER P., KLEINSCHMIDT A., REES G. (2009): The neural bases of multistable perception, Trends in Cognitive Sciences 13 (7), 310–318.
TAEED L. K., TAEED O., WRIGHT J. E. (1988): Determinants involved in the perception of the necker cube: an application of catastrophe theory, Behavioral Science 97–115.
TONG F., MENG M., BLAKE R. (2006): Neural bases of binocular rivalry, Trends in Cognitive Sciences 10 (11), 502–511.
VAN LUIJTELAAR E. L. M., HRAMOV A. E., SITNIKOVA E., KORONOVSKII A. A. (2011): Spikewave discharges in WAG/Rij rats are preceded by delta and theta precursor activity in cortex and thalamus, Clinical Neurophysiology 122, 687–695.
WANG X.-J. (2012): Neural dynamics and circuit mechanisms of decision-making, Current Opinion in Neurobiology 22 (6), 1039–1046.
WORLD MEDICAL ASSOCIATION (2000): Declaration of Helsinki: ethical principles for medical research involving human subjects, The Journal of the American Medical Association 284 (23) (2000) 3043–3045.